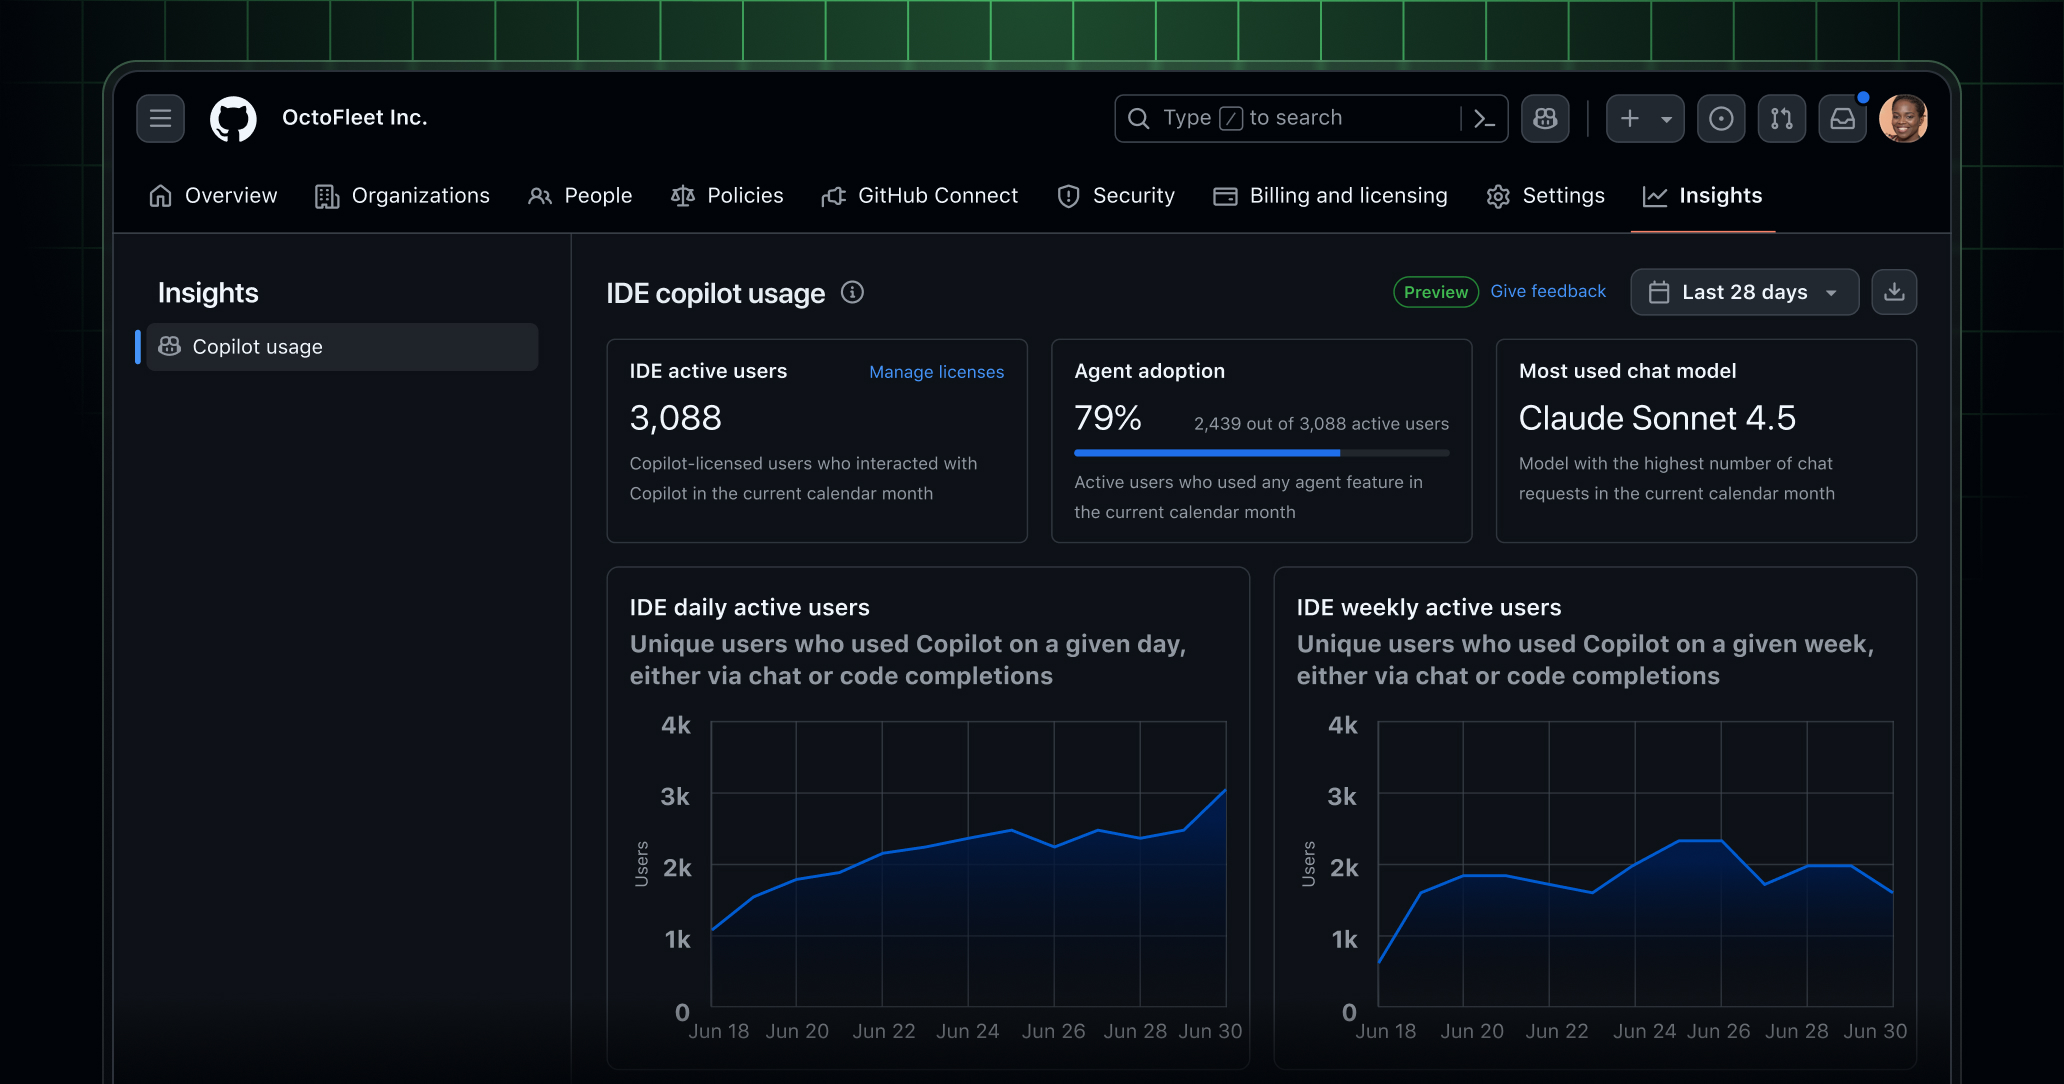
📸 Copilot usage metrics dashboard and API in public preview ...
GitHub Copilot Metrics Complete Guide 2026 — How to Prove AI Adoption Impact with Data
On February 27, 2026, GitHub announced the general availability (GA) launch of Copilot Metrics (Copilot Usage Analytics). This feature enables teams and organizations to track and analyze how effectively they're using GitHub Copilot from a single dashboard. For development team leaders and engineering managers who need to prove AI adoption ROI with data, this is an essential feature to know about.
📸 GitHub - microsoft/copilot-metrics-dashboard: The GitHub ...
What is Copilot Metrics?
GitHub Copilot Metrics is an integrated platform that collects, analyzes, and visualizes Copilot usage data within organizations. From individual developer productivity improvements to team-wide AI adoption trends, you can access all the insights needed for decision-making in one place.
This GA version, significantly improved based on feedback from numerous enterprise customers during the public preview period, goes beyond simple usage aggregation to provide meaningful developer productivity insights.
📸 GitHub Copilot · Your AI pair programmer · GitHub
Key Feature 1: Unified Team Dashboard
Key metrics you can view in the Copilot Metrics dashboard:

📸 What is GitHub Copilot? | ESPC Conference, 2026
Copilot Adoption Rate and Active Users
- Daily/Weekly/Monthly Active Users
- Seat Utilization Rate: Actual usage ratio compared to licenses
- Feature-Specific Usage: Code completion, chat, PR summaries, etc.
- Editor Distribution: VS Code, JetBrains, Neovim, etc.
Code Productivity Metrics
- Code Suggestion Acceptance Rate: Percentage of Copilot suggestions accepted by developers
- AI-Generated Code Ratio: Percentage of code written with Copilot assistance in total commits
- Lines of Code Saved: Estimated development time saved through AI assistance
- Language-Specific Usage: Usage patterns by language such as TypeScript, Python, Go, etc.
Key Feature 2: Trend Tracking and Time-Series Analysis
Beyond simple current figures, Copilot Metrics tracks trends over time. This enables you to:
- Verify whether productivity has actually improved after Copilot adoption
- Identify AI usage patterns during specific periods (release cycles, sprints, etc.)
- Compare adoption speeds across teams and repositories
- Measure user response after new feature releases
For example, you can analyze time-series data to see how Copilot acceptance rates change after onboarding new team members, or whether AI-generated code quality improves as code review feedback is incorporated.
Key Feature 3: Data Integration via REST API
The Copilot Metrics API is officially supported with the GA launch. This allows you to integrate Copilot data with your organization's existing analytics infrastructure:
# Copilot Metrics API call example
curl -L \
  -H "Accept: application/vnd.github+json" \
  -H "Authorization: Bearer {TOKEN}" \
  "https://api.github.com/orgs/{org}/copilot/metrics"
What you can do with the returned data:
- Grafana/Datadog Integration: Add Copilot metrics to existing monitoring dashboards
- Slack/Teams Notifications: Automated weekly Copilot usage reports
- BI Tool Integration: AI productivity analysis in Tableau, Power BI
- Custom Reports: Automate ROI calculations for executive reporting
Key Feature 4: Copilot Content Exclusion REST API (Public Preview)
The Content Exclusion REST API, also released in public preview on the same day, is an important feature for security and compliance. Organization and enterprise administrators can programmatically manage Copilot content exclusion rules.
Use cases:
- Automatically exclude sensitive source code files from Copilot training data
- Protect configuration files containing API keys and secrets
- Automatically meet compliance requirements in regulated industries
- Automate management of team-specific custom exclusion rules
GitHub Issues Semantic Search (Launched Together!)
On February 26, Semantic Search was introduced to the GitHub Issues dashboard in public preview. You can search for related issues using natural language even if you don't remember exact keywords.
Examples:
- "Error during login" → Automatically discovers related bug issues
- "Slow performance page" → Shows all performance-related issues
- "Migration work" → Integrated search for database and API migration issues
Proving ROI with Copilot Metrics: Practical Strategies
Step 1: Baseline Measurement
Set data from 1-2 weeks immediately after Copilot adoption as your baseline. Record code acceptance rates, active user ratios, and repository-specific usage patterns.
Step 2: Set Target KPIs
- Code acceptance rate target: 30% or higher
- Team adoption rate target: 80% or more of all developers actively using
- AI-generated code ratio target: 20% or higher
Step 3: Monthly Trend Review
Analyze Copilot Metrics data monthly to understand progress against goals, and provide additional training or support to teams with low usage rates.
Step 4: Executive Reporting
Generate automated monthly ROI reports using the Metrics API. Calculate ROI as "Development time saved through AI assistance × cost per developer hour" and report transparently to executives.
New Security Features in GitHub Enterprise Server 3.20
In February 2026, GitHub Enterprise Server 3.20 was also released. Key changes:
- Improved PR Merge Experience: Enhanced merge strategy selection and history management
- Immutable Releases: Lock deployed releases to prevent changes, strengthening supply chain security
- Enhanced Secret Scanning: More vendor patterns, automatic fix suggestions
- Backup Service GA: Official support for enterprise data protection
- Enhanced Team Role-Based Access Control: More granular permission management
Summary: Why Copilot Metrics Matters
The biggest challenge in adopting AI tools is proving effectiveness with numbers. The GA launch of Copilot Metrics solves this problem. Development team leaders can now prove the value of AI investments based on data and systematically support team members in using AI tools.
GitHub Copilot Metrics is no longer just a usage tracking tool. It's a strategic platform for building an AI-first development culture, continuously improving team productivity, and proving ROI to executives.
댓글
댓글 쓰기